
 Facebook
 Twitter
 Pinterest
 Copy Link
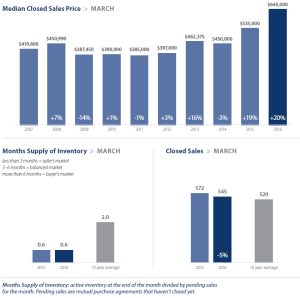
Local Market Update – April 2016
The supply of available homes remains at critical levels, with both King and Snohomish counties showing less than a month’s supply of inventory. With demand far outstripping supply, home prices increased by double-digits over last year throughout the Puget Sound area. The red hot market allows sellers to call the shots. Since some sellers are hesitant to put their home on the market for fear they won’t be able to find their next home quickly enough, many are negotiating with buyers to stay in their house for several months after the sale to ease the transition.
Eastside

Click image for full report.
King County

Click image for full report.
Seattle
Click image for full report.
Snohomish County

Click image for full report.
Homeowner’s Net Worth is 45x Greater Than a Renter’s
Every three years the Federal Reserve conducts a Survey of Consumer Finances in which they collect data across all economic and social groups. The latest survey, which includes data from 2010-2013, reports that a homeowner’s net worth is 36 times greater than that of a renter ($194,500 vs. $5,400).
In a Forbes article the National Association of Realtors’ (NAR) Chief Economist Lawrence Yun predicts that in 2016 the net worth gap will widen even further to 45 times greater.
Read the full post on Keeping Current Matters.
The Gardner Report – Fourth Quarter 2015

Economic Overview
The Washington State economy has added almost 370,000 jobs since the lowest point of the recession at the start of 2010. Additionally, total employment is 176,000 jobs higher than seen at the 2008 peak. With a vast majority of our metropolitan areas having fully recovered from the job losses seen during the recession, I expect to see somewhat more modest job growth in the coming year. That being said, our economy will continue to expand, which will be a benefit to our region’s housing market.
Home Sales Activity
- There were 16,895 home sales during the fourth quarter of 2015, up by 4.6% from the same period in 2014. Sales activity is starting to slow somewhat but this is due to inventory constraints.
- The growth in sales was most pronounced in Cowlitz and Lewis Counties and double-digit growth was also seen in Thurston County. Sales declines were seen in Grays Harbor County and Skagit County, but only minimally.
- The number of home sales grew in all but two counties, with the average number of sales up by almost 6% from the same period in 2014.
- I am not surprised to see some decline in sales start to appear. Listing activity was down by 28% compared to the fourth quarter of 2014, and there were no counties where there were more homes for sale in Q4-2015 versus Q4-2014.

Home Prices
- Prices in the region rose by an average of 9.3% on a year-over-year basis but were 0.4% lower than seen in the third quarter of 2015.
- Unsurprisingly, no counties saw a drop in average home prices compared to fourth quarter last year.
- When compared to the fourth quarter of 2014, San Juan County again saw the fastest price growth with an increase of 37.6%. However, this county is notorious for extreme swings given the huge variations in prices in the San Juan Islands. Double-digit percentage gains were also seen in five other counties.
- As long as inventory constraints persist, it is likely that price growth will continue. That said, modest increases in interest rates, in combination with declining affordability conditions in several markets, will likely slow price appreciation.

Days on Market
- The average number of days it took to sell a home dropped by nine days when compared to the third quarter of 2014.
- It took an average of 78 days to sell a home in the fourth quarter of this year—down from the 91 days it took to sell a home in fourth quarter of last year.
- There were just two markets where the length of time it took to sell a home did rise, but the increases were minimal. Jefferson County saw an increase of eight days while Mason County rose by two days. King County remains the only market where it takes less than a month to sell a home.

Conclusions
 This speedometer reflects the state of the region’s housing market using housing inventory, price gains, sales velocities, interest rates, and larger economics factors. For the fourth quarter of 2015, I have left the needle at the same position as the previous quarter. In as much as the market is still very heavily in favor of sellers, I fear that some markets are reaching price points that will test affordability. Furthermore, while inventory levels are likely to see some growth in 2016, it will not be enough to satisfy demand, adding further upward pressure to prices. Overall, 2015 was a stellar year with sales volumes and home prices moving higher across the board. In 2016, I believe we’ll see some growth in sales activity, as well as continued price growth – just at more modest levels than last year. Interest rates are going to rise moderately through the year, but still remain very competitive when compared to historic averages. In other words, any increase in interest rates should not be a major obstacle for home buyers. Looking forward, I believe 2016 will be a year of few surprises. Because it is an election year, I do not expect to see any significant governmental moves that would have a major impact on the U.S. economy or the housing market.
 Matthew Gardner is the Chief Economist for Windermere Real Estate, specializing in residential market analysis, commercial/industrial market analysis, financial analysis, and land use and regional economics. He is the former Principal of Gardner Economics, and has over 25 years of professional experience both in the U.S. and U.K.
King County Had Almost Half of 2015’s 30 Most Competitive Neighborhoods in America
We probably don’t need to tell you that 2015 was a crazy year in real estate, especially in our area. Bidding wars and listings lasting mere days on the market is something we’ve all grown accustomed to. But it turns out we’re not alone. Curbed recently published an article that focused on the 30 most competitive neighborhoods in America. What’s the most mind blowing thing about this list? Of the 30 neighborhoods listed, 13 of them are in King County.

The Eastside was well represented on this list with Bellevue and Redmond making huge claims. Overlake was was the second-most competitive market in the entire nation! Honorable mentions were Grass Lawn (#7), Newport Hills (#14), Idylwood (#28), and Newport (#30).
It’s hard to say exactly what 2016 has in store, but our very own Chief Economist, Matthew Gardner, has a few ideas (such as expecting that housing in Seattle will continue to appreciate in value, but at a slightly lower rate than 2015).
Read more on Seattle Curbed.
Thinking of Buying a Home? Ask Yourself These 3 Questions
If you are debating purchasing a home right now, you are surely getting a lot of advice. Though your friends and family will have your best interest at heart, they may not be fully aware of your needs and what is currently happening in real estate. Let’s look at whether or not now is actually a good time for you to buy a home.
There are 3 questions you should ask before purchasing in today’s market:
1. Why am I buying a home in the first place?
This truly is the most important question to answer. Forget the finances for a minute. Why did you even begin to consider purchasing a home? For most, the reason has nothing to do with finances. A study by the Joint Center for Housing Studies at Harvard University reveals that the four major reasons people buy a home have nothing to do with money:
2. Where are home values headed?
When looking at future housing values, Home Price Expectation Survey provides a fair assessment. Every quarter, Pulsenomics surveys a nationwide panel of over 100 economists, real estate experts and investment & market strategists about where prices are headed over the next five years. They then average the projections of all 100+ experts into a single number.
So what does that really mean for you and your family?
Read the rest of the article on Keeping Current Matters.
Local Market Update September 2015
The real estate market traditionally cools off in the summer, but August saw a continuation of the market’s hot streak. Home prices increased by double digits over a year ago, fueled by strong demand and the lowest inventory in more than a decade. Rising prices are kindling hopes that more sellers will be willing to put their home on the market.
Eastside

Home values on the Eastside continue to be the highest in the region. The median price for homes sold in August was up 11 percent to $672,000. Very limited inventory translated into brisk sales as buyers snapped up homes at every price point. A $3.7 million home on Yarrow Point sold in just four days after being listed.
King County

The median price for a single family home in King County was $499,950, a 14 percent increase over last August. Inventory has inched up, but the five weeks of existing supply is far below the three to six months of supply that is considered to be balanced. Condo sales were strong, with 22 percent more sales than a year ago.
Snohomish County

Buyers frustrated with high home prices in King County have been drawn to Snohomish County in search of finding more home for their dollar. That demand has driven down inventory, which stands at just under two months of supply. Demand has also pushed prices higher. The median price of a single family home rose 11 percent over a year ago to $366,825.
Local Market Update August 2015
We’re still having record heat in the Puget Sound region, and our home prices are rising with the thermometer. It’s still a roaring seller’s market out there, especially on the Eastside. We continue to have local markets in dire need of inventory, so this is an excellent time to list your home and take advantage of the current market.
• The months supply of inventory continues to decline from the prior year in Seattle and the Eastside, as well as King and Snohomish counties.
• Closed sales on the Eastside have started to decrease in number due to seasonal trends and lowered inventory.
• The majority of those Eastside closed sales in July sold over original list price.
Eastside
 The Eastside had the highest increase in home sales prices since last July, increasing 9 percent to $681,600. We continue to have the highest median home prices in the region. Inventory had the slightest increase since June's 1.1 months of inventory with July holding 1.2 months (a balanced market reflects 3 to 6 months of inventory). Total closed sales dropped to 932, 3 percent less than July 2014 and 5 percent than last month's 981 total closed sales on the Eastside.
King County
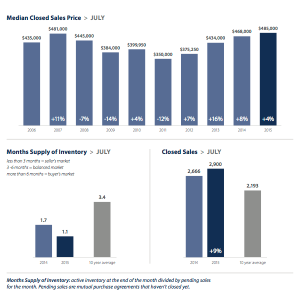 Inventory actually increased for the third month in a row, but was still held at a stark 1.1 months supply. While median sales prices fell 3 percent from the previous month, July's sales prices were still 4 percent higher than the previous year at $485,000. With inventory so low and the county's higher prices, many potential buyers are being pushed farther out than they would have previously wanted to buy.
Snohomish County
 Snohomish County has increased its median sales price 8 percent since July 2014 to $362,987 last month. It holds a stronger, though less than normal, inventory of 1.5 months. The number of closed sales has increased sharply to 1,156 in July, a 19% increase since the previous year. While many potential buyers are being forced out of the Eastside and the Seattle area, Snohomish County proves to be a less expensive and more promising market.
Homeownership Has Declined, But It Won’t Be Forever
Below is an article from Windermere's Chief Economist Matthew Gardner. He shares his views of the declining homeownership, and why he believes it won't be a lasting trend.
In addition to talking about housing bubbles, another topic that is becoming popular among housing scaremongers is the ongoing decline in the U.S. homeownership rate. Remarks range from the direct, “American homeownership is at its lowest level in more than two decades,” to the downright inflammatory, “Rental surge to drop homeownership rate to 61.3% by 2030”. When I read statements like this it always drives me to dig into the data to see what is really going on.
The data that everyone uses to track homeownership is provided by the U.S. Census Bureau, which publishes quarterly stats on ownership rates dating back to 1965. As you can see in the chart below, the rate remained remarkably stable between 1965, when it registered at 62.9%, and 1994, when it was 63.8%. For the purposes of this discussion, I have highlighted three presidential terms: two under President Clinton and President George W. Bush’s first term.
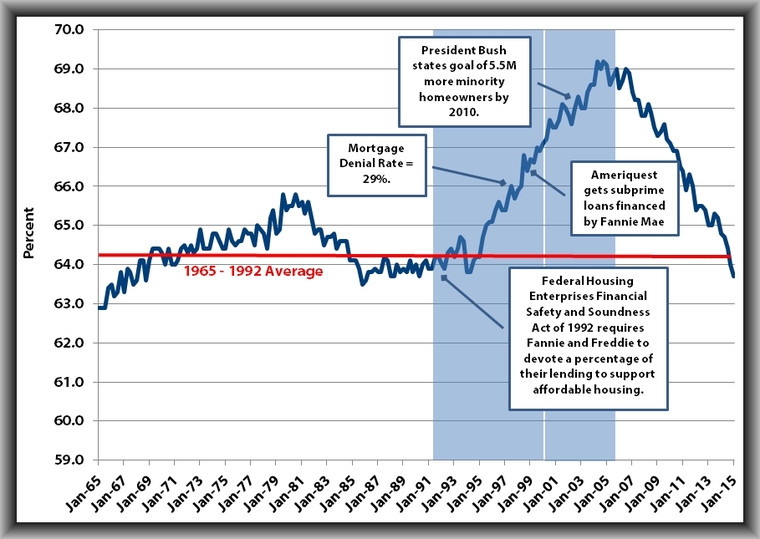
The “boom times” for housing essentially started after the election of President Clinton, who went to remarkable lengths to encourage homeownership. Readers may remember the 1994 National Homeownership Strategy when the President directed HUD to come up with a viable plan to increase homeownership. And it worked; during the Clinton administration, homeownership rose from 64.2% to 67.1%.
During his first term, President Bush continued the practice of encouraging homeownership, as it dovetailed with his Ownership Society goals. His, and President Clinton’s efforts, led to the highest home ownership rates on record, peaking at just over 69% (about 5% higher than record-keeping averages). But as we all know now, it also led to the burst of the biggest housing bubble in our nation’s history. Yes, ownership rates skyrocketed, but the market was artificially inflated and unsustainable. Home ownership rates have since dropped to 63.7%, but this is only marginally below the long-term average of 64.3. Hardly calamitous as some are suggesting.
That said, I do think that that the rate could fall a little further. Now, before you start blaming the Millennial generation, stop, because they are not the ones leading this charge. (As a side note, I do feel rather sorry for this group, as they appear to be taking the brunt of any and all economic woes at the moment.) If we look at homeownership rates by age, between 1994 and today, the decline in homeowners under the age of 35 is 2.5%. A palpable drop, but slight when compared to 35-44 year olds who have seen their numbers drop by 6% – from 64.4% to 58.4%. Why? Because this group took the largest hit following the housing crash, and many lost their homes to foreclosure.
Circling back to Millennials, it’s true that this group is more subdued relative to homeownership – and there’s good reason for it. Millennials comprise a smaller share of married couples and a higher share of in-city dwellers versus suburbs. But their lack of growth may well be offset by middle-aged families who are thinking about getting back into homeownership again. According to RealtyTrac, while Millennials have gotten a lot of attention lately as the generation whose below-normal homeownership rates are changing the landscape of the U.S. real estate market, the boomerang buyers — who are primarily Generation Xers or Baby Boomers — represent a massive wave of potential pent-up demand that could shape the housing market in the short term even more dramatically.
Data from Transunion supports this theory, suggesting that there are about 700,000 consumers who will become eligible to re-enter the housing market in 2015, and up to an additional 2.2 million potential buyers will requalify over the next five years. It’s likely that these so called “boomerang buyers” will become homeowners again, which will do its part to offset the Millennial drop, and raise the homeownership rate back up to its historic averages.
So, have homeownership rates declined? Yes, but as the data and this analysis show, taking a simple “peak-to-trough” view of homeownership figures does not necessarily provide accurate results. Regardless of how many scaremongers declare otherwise.
Visit the Windermere blog for the original article.
Local Market Update July 2015
Along with temperatures, the housing market sizzled in June. Continued low inventory coupled with ever-increasing demand pushed home prices in King County to an all-time high. The multiple offers and escalation clauses that have now become common make it a very hot market for sellers.
• Home prices in King County surpassed their 2007 peak.
• The number of closed sales in King County increased 17 percent over last June.
• Record low inventory continues to fuel competition among buyers.
Eastside

While sales on the Eastside jumped 23 percent, inventory remains very tight. With very little new construction in the pipeline, low inventory is expected to continue until more sellers are willing to list their homes. An incentive is the continued price appreciation here. The median home price was up 6 percent to $670,000, the highest of any King County region.
King County

There were almost 24 percent fewer homes for sale in June as compared to the same time last year. As a result, competition for homes is fierce, with first-time home buyers competing with foreign buyers and those moving here for new jobs. King County saw the median price of a home soar 10 percent over last June to $500,000 – an all-time high.
No Housing Bubble In Sight – For Now

Windermere's chief economist, Matthew Gardner, recently shared some insight on what we're currently seeing in our local housing market. Here is his commentary, originally posted on Windermere.com.
Exactly 10-years ago this month, Alan Greenspan was asked if he had any concerns regarding the housing market. At that time, he emphasized that he saw no sign of a nationwide housing bubble, but he did have concerns over "froth" in the market and pointed to a big increase in the purchase of investment properties — particularly in second homes. As a result, he said, there are "a lot of local bubbles" around the country, but not at a national level.
As we are all very much aware, he, along with many other esteemed economists, was incorrect in his prediction that there was no national housing bubble in sight.
So here we are, a decade later, and some are starting to suggest that we are on the verge of another “bubble” bursting due to an overheated housing market. I’m often asked if there is any truth to this, and my response is no, I don’t believe there is a national bubble on the horizon. And here are the reasons why:
1. The flippers have left the building – in as much as it causes me untold angst to see the resurgence of reality TV programs espousing the wonders of house flipping, the country has seen a marked slowdown in this type of business. Why? Well one reason is that the number of foreclosed homes continues to drop. Foreclosures are the preferred property type for flippers, as margins can be significantly higher.
2. Lending standards remain very stringent – Banks actually did learn a lesson from the collapse of the housing market and remain wary, and because of this, qualifying for a mortgage remains difficult. For example, in April of this year, the average FICO score required for an approved conventional home loan was 756 with a 19 percent down payment. The average FICO score for someone who was denied a loan (with an average down payment of 17 percent) was very high at 699.
3. Home prices are up, but not to pre-bubble levels – here I looked at data provided by S&P Case Shiller index which is a useful resource because it calculates the increase/decrease in value of the same house over time, rather than just the make-up of sales during a specific time period. At the national level, the bursting of the housing bubble led to a 27 percent drop in the index. The index has risen back up but is still 9 percent below the prior peak.
4. Interest rates are going to (eventually) start to rise – and this will take some of the heat out of the market. Now, there are some who will say that any increase in mortgage rates will negatively impact the housing market, but I don’t agree. Although it is true that an increase in rates does decrease buying power, the naysayers are ignoring the fact that we are in a growing economy. The growth in employment, and the subsequent drop in the unemployment rate, will lead to wage growth, and increasing incomes will take some of the sting out of any rate increase.
Given all of these points, I do not see the risk of a national “housing bubble” anywhere in the foreseeable future; however, I do think we are seeing localized “froth” in some markets.
View the original post by Matthew Gardner on the Windermere blog.
